Inside PropTech's $82B Capital Cycle
Four years of PropTech deal data reveal a modest rebound in investment volume and a reshuffling of sector demand.


Guest Post | This analysis is authored by Harrison Mack, a former star MetaProp intern. He is now a Vice President and the Head of Acquisitions at Aker, a vertically integrated multifamily real estate investment manager. He holds a Master's degree in Computer & Information Technology from the University of Pennsylvania School of Engineering & Applied Sciences and a Bachelor of Science in Economics from The Wharton School.
The PropTech venture capital sector saw a moderate rebound in 2025, displaying green shoots for a sector trending toward recovery but well short of historic highs; adjusting for later-stage infrastructure spend (concentrated in several large transactions), significant capital was deployed across the sector but shy of recent peaks, as investors continue to back founders addressing a seemingly insatiable demand for compute capacity.
The following data details reported PropTech funding rounds from 2022 through 2025, scraped from industry publications, press releases, and fund announcements on a daily cadence, to build a ground-level view of capital formation in real estate technology. The dataset represents 1,838 unique funding rounds, over 1,580 unique companies, more than 3,300 unique investors, and $82 billion in total capital deployed.
Cross-referenced with CRETI's year-end findings and Crunchbase sector data, this analysis offers a practitioner's view of active players, companies and recent trends in the sector. See a detailed exploratory workbook at the git repository linked here, data limited through Sep-2025.
Methodology Note: This analysis is based on 1,838 funding rounds tracked from January 2022 through December 2025, sourced from industry publications, press releases, and fund announcements. The dataset captures publicly reported rounds and may not include undisclosed financings. Sector and stage classifications reflect author judgment at time of entry. Data was cross-referenced with CRETI's 2025 Year-End Report and Crunchbase sector analyses. This is an informal analysis and does not constitute investment advice.
At a Glance
2025 saw $22.1 billion across 408 rounds in tracked PropTech & Infrastructure funding, a 34% year-over-year increase from 2024's $16.5 billion and 26% year-over-year increase from 2024's 325 rounds.
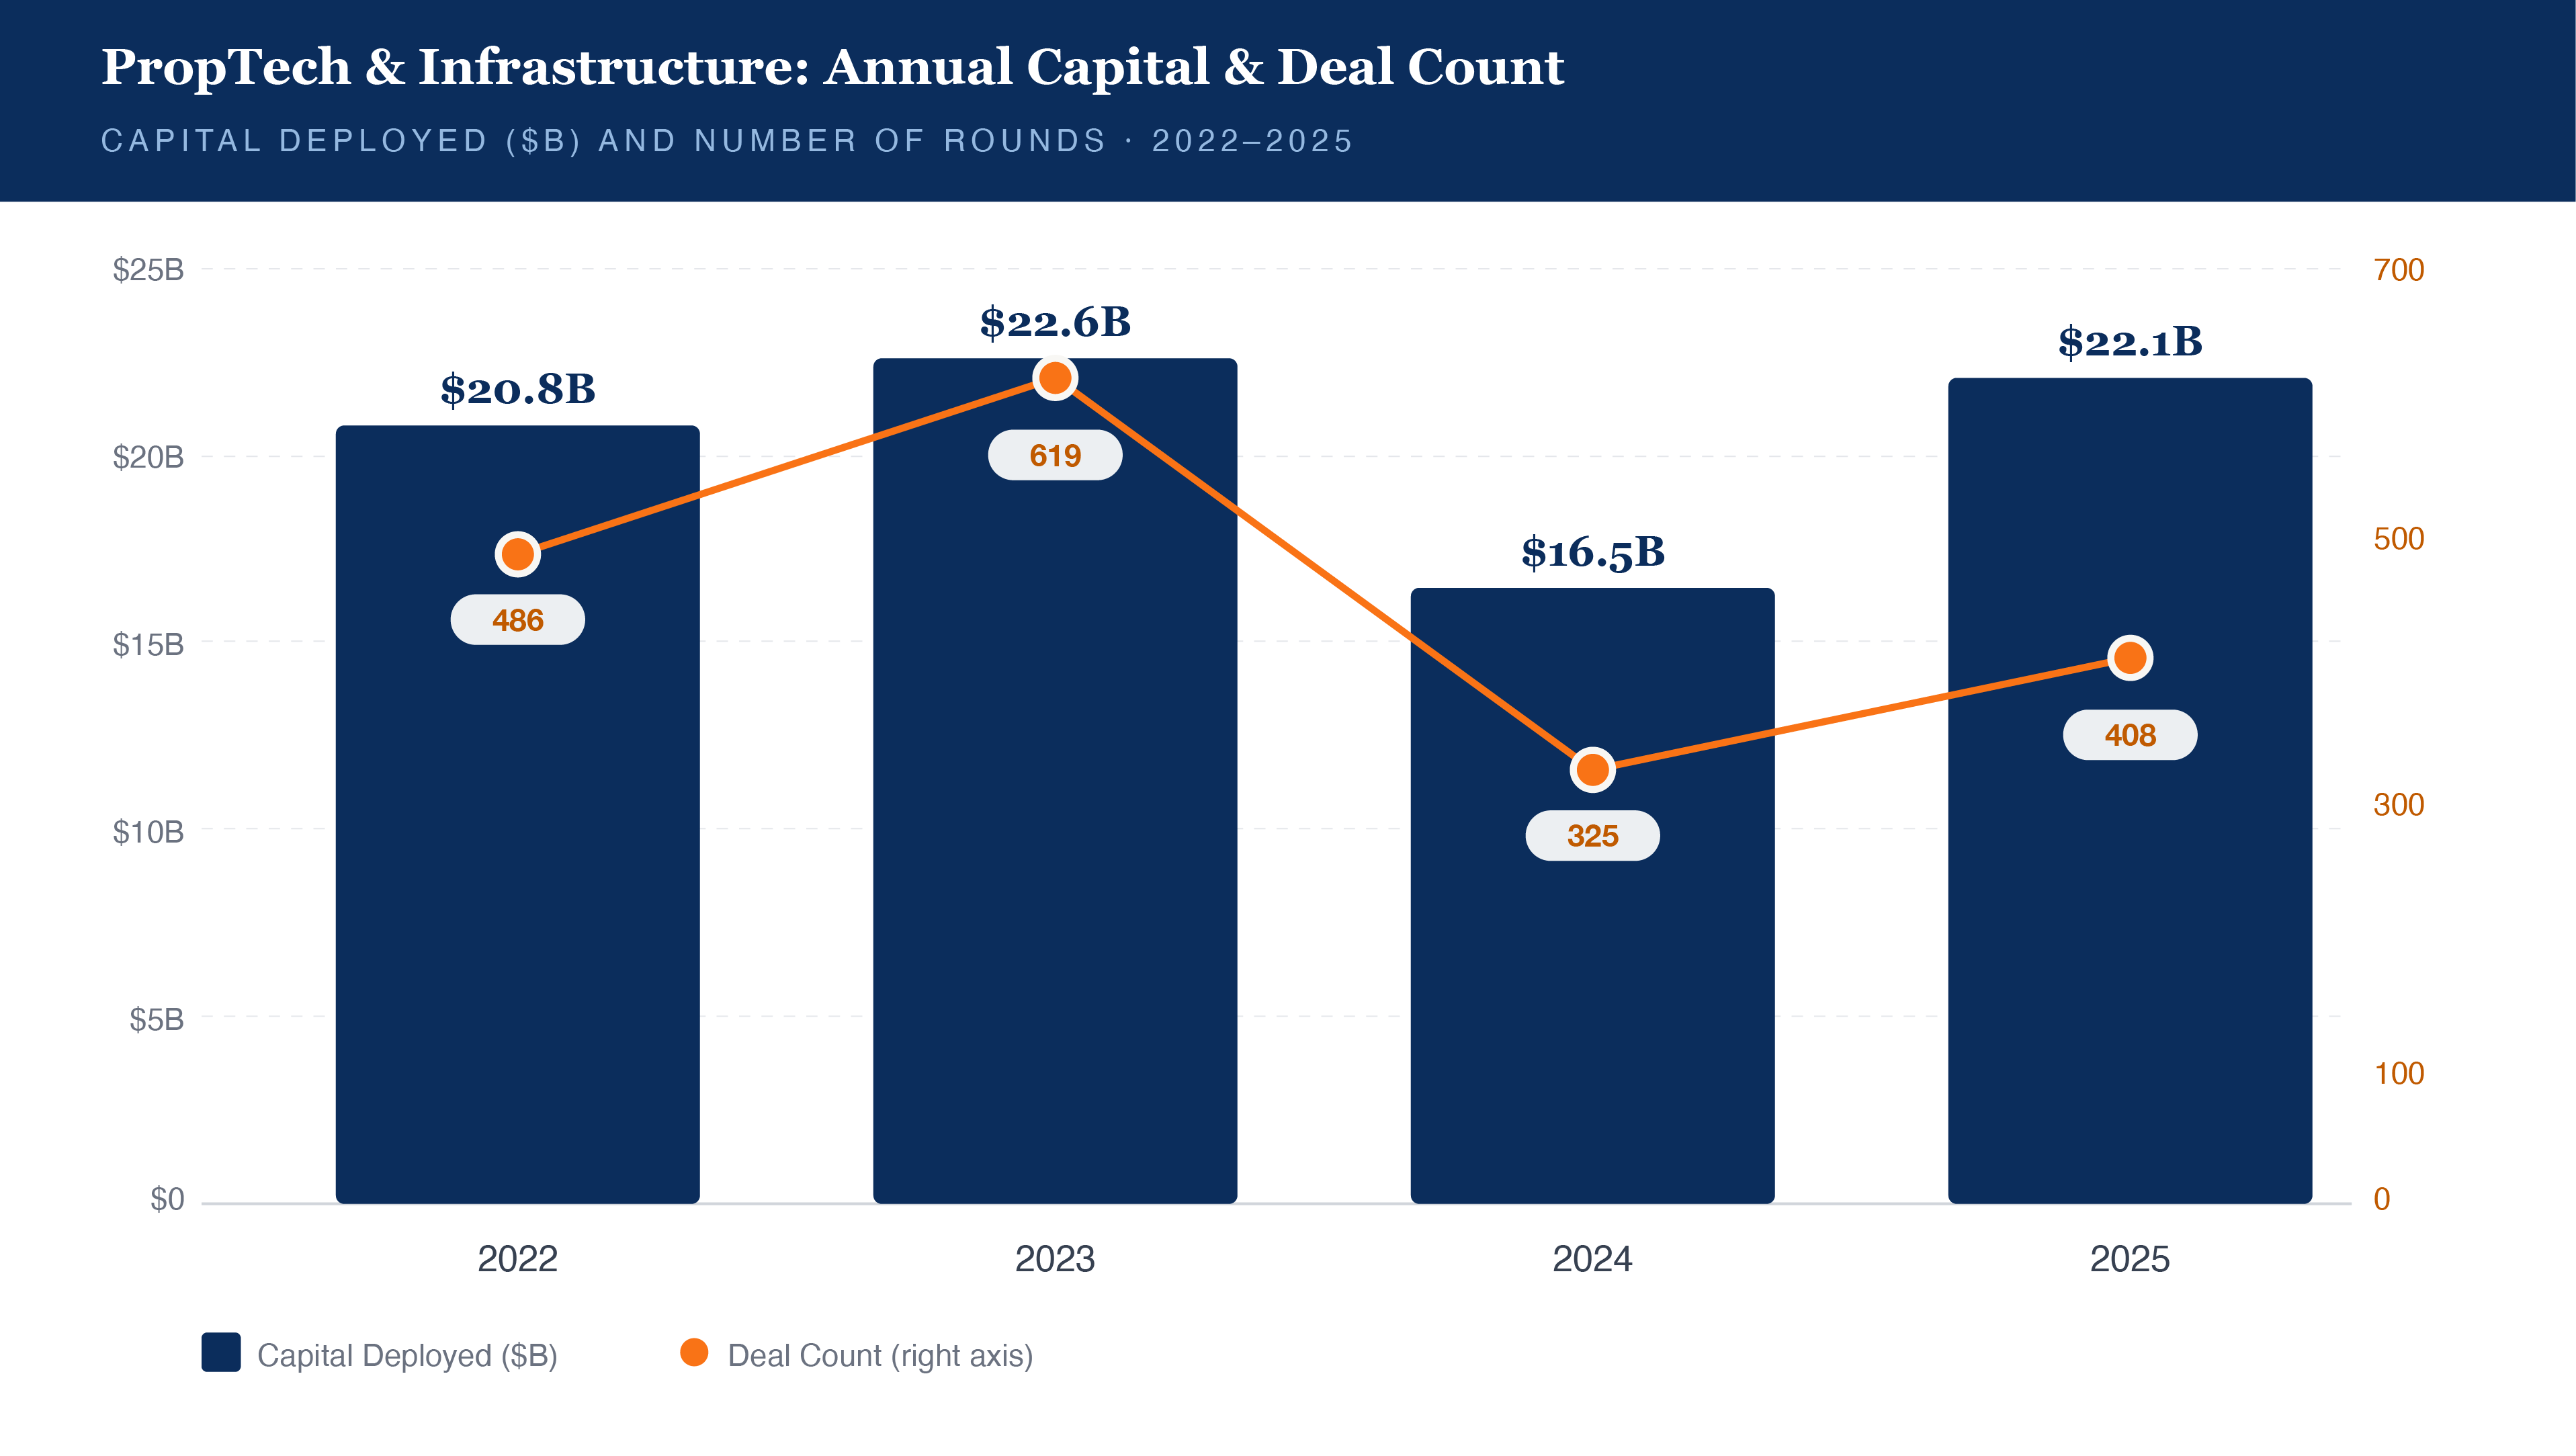
In 2023, total capital actually increased slightly over 2022 to $22.6 billion, while observed deal count jumped 27% even as median round sizes contracted from $19.5 million to $10 million. 2024 volume dropped substantially by 27% while deal count cratered 48%. The market was clearing out companies that couldn't demonstrate sustainable unit economics in a post ZIRP era.
By 2025, remaining companies attracted larger checks. The median round recovered to $15 million, and critically, fewer companies competed for investor attention - not a return to volume, but a concentration of capital.
Quarterly Analysis
Back-Half Acceleration
Zooming into the quarterly data and a clear pattern emerges: PropTech capital deployment is increasingly back-half weighted. Both 2024 and 2025 saw dramatic Q3-Q4 acceleration.
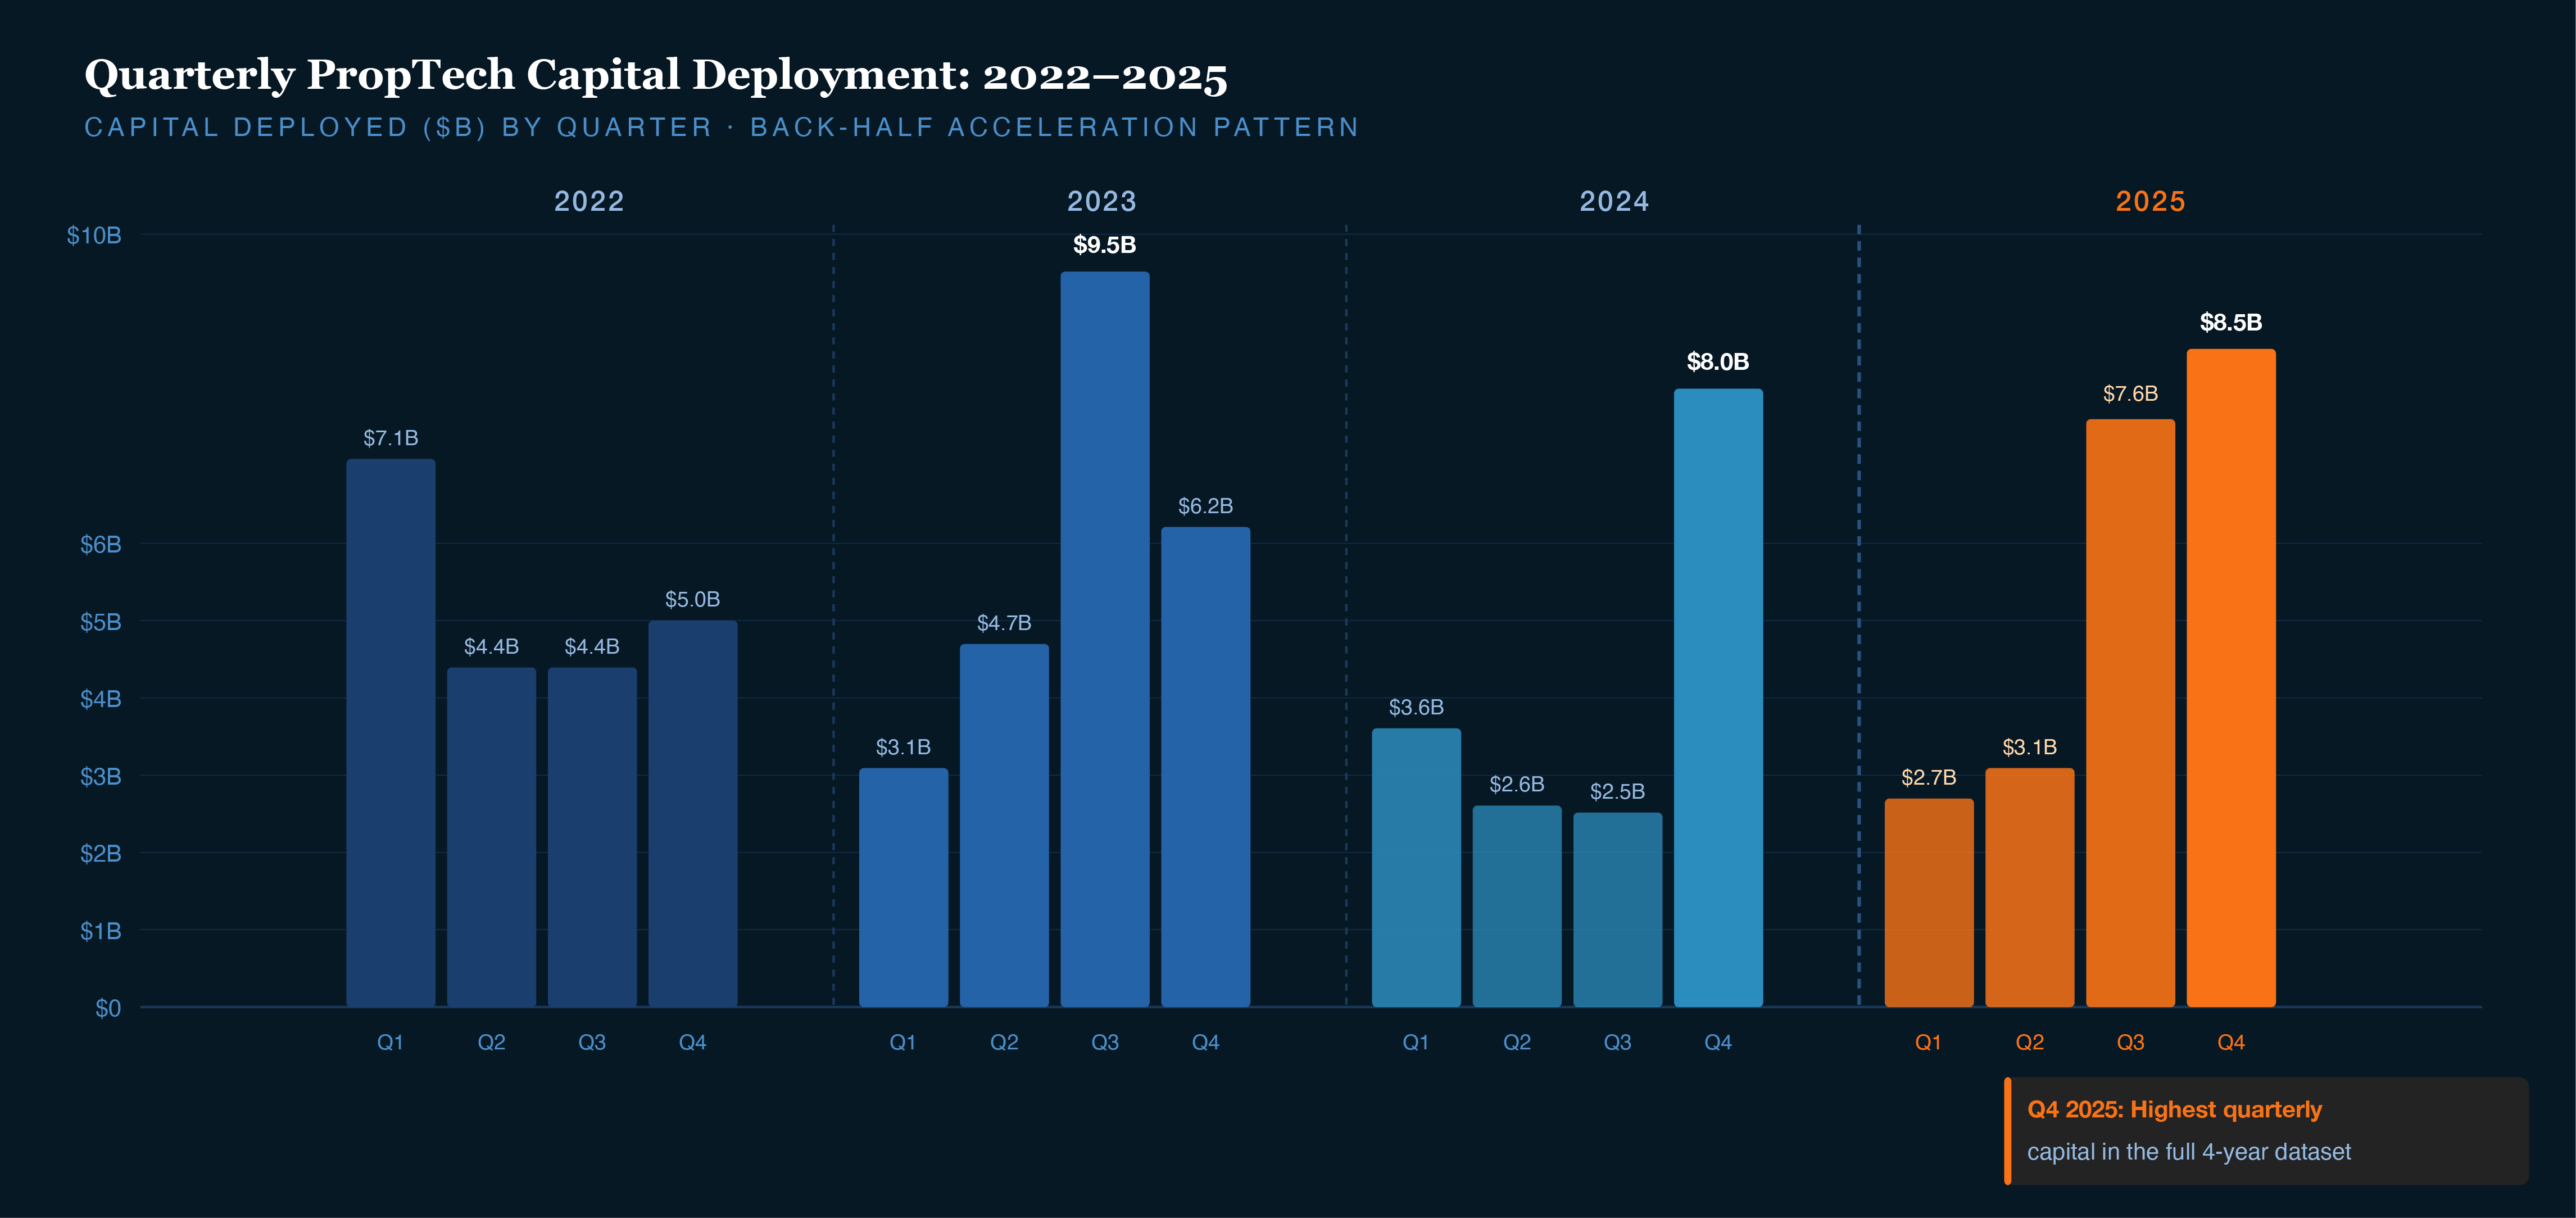
In 2024, Q4 alone accounted for nearly half the year's total ($8.0 billion of $16.5 billion). The pattern repeated in 2025: a relatively subdued first half ($6.0 billion in H1) gave way to a surge ($16.1 billion in H2). Q4 2025 recorded $8.5 billion across just 91 deals - the highest quarterly capital figure in the entire dataset. The trend is largely driven by mega-rounds that tend to close in the back half as sponsors finalize their own fundraising.
Stage Dynamics
Early & Growth Stage Capital
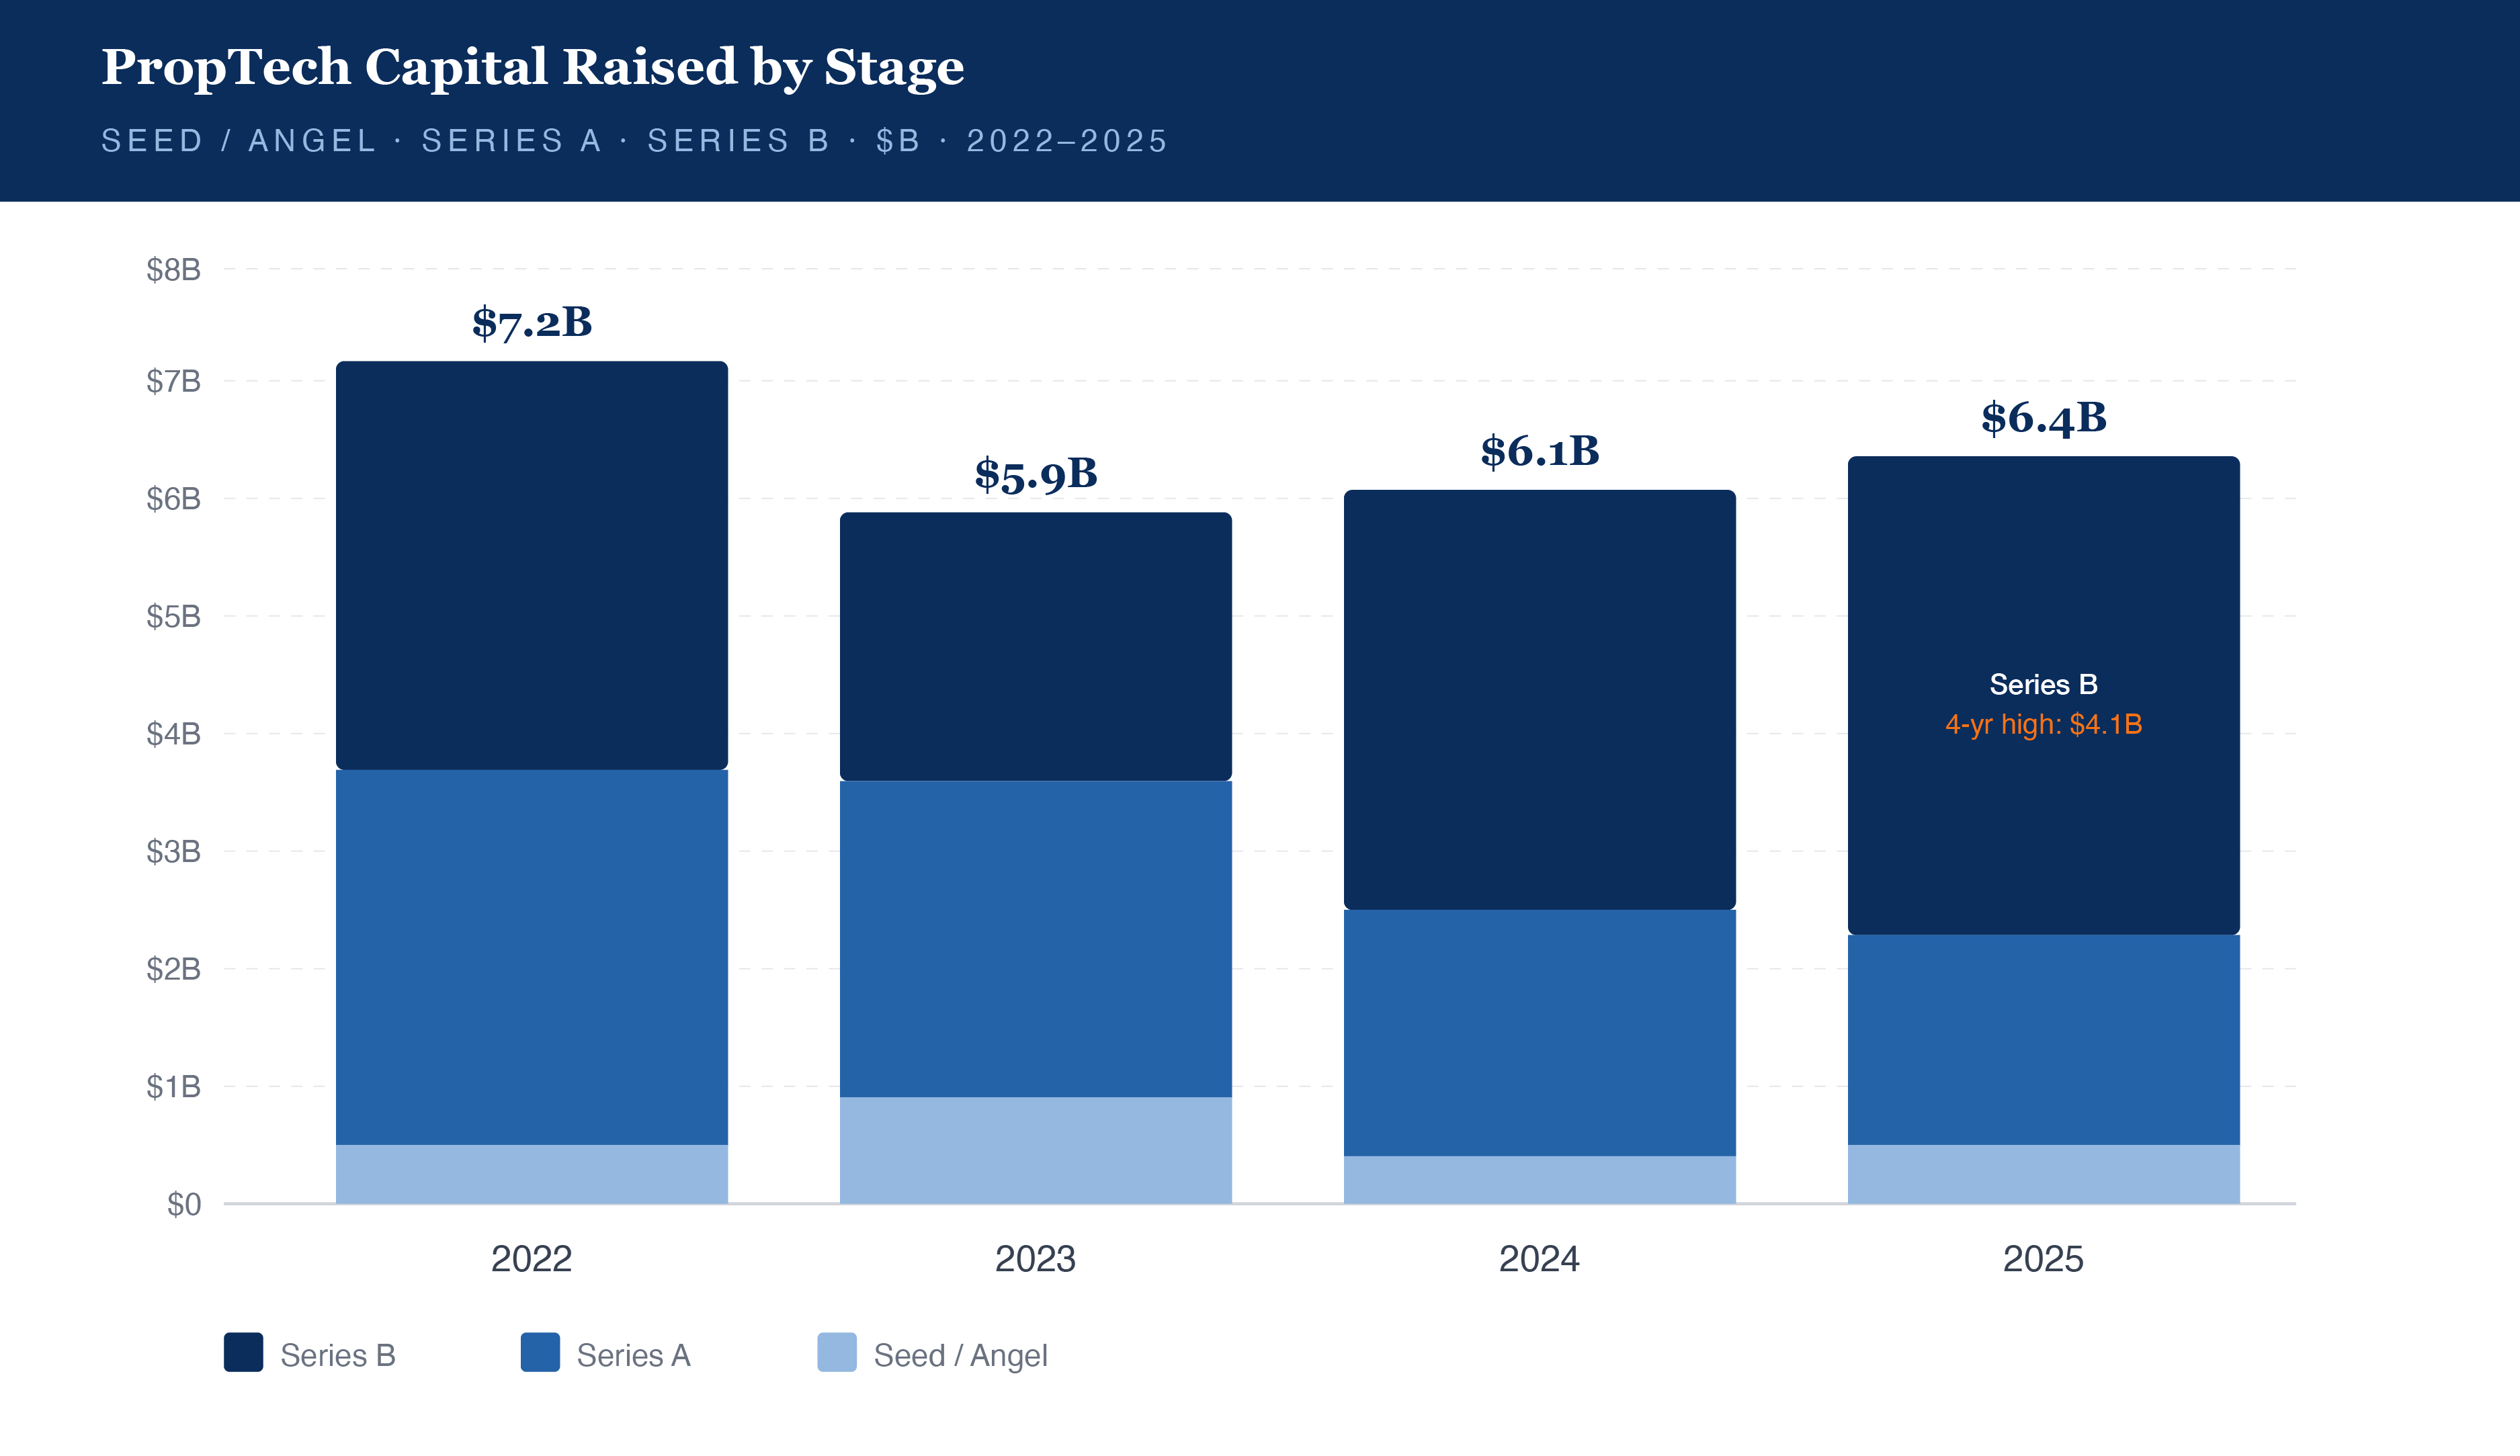
Series B dominates capital deployment, accounting for $15.3B of the $25.7B total (59%) across these three stages over four years. Series A contributed $7.8B (30%), while Seed/Angel deployed just $2.6B (10%). The barbell demonstrates the vacuum of pre-COVID bets that failed to cross the chasm and a new wave of early, AI-native bets, with capital concentrating heavily in growth rounds for proven winners.
The 2025 pattern is notable: Series B capital hit its four-year high ($4.1B), even as Seed and Series A remained below 2022 peaks. Growth-stage investors returned for companies that cleared the 2023-2024 reset.
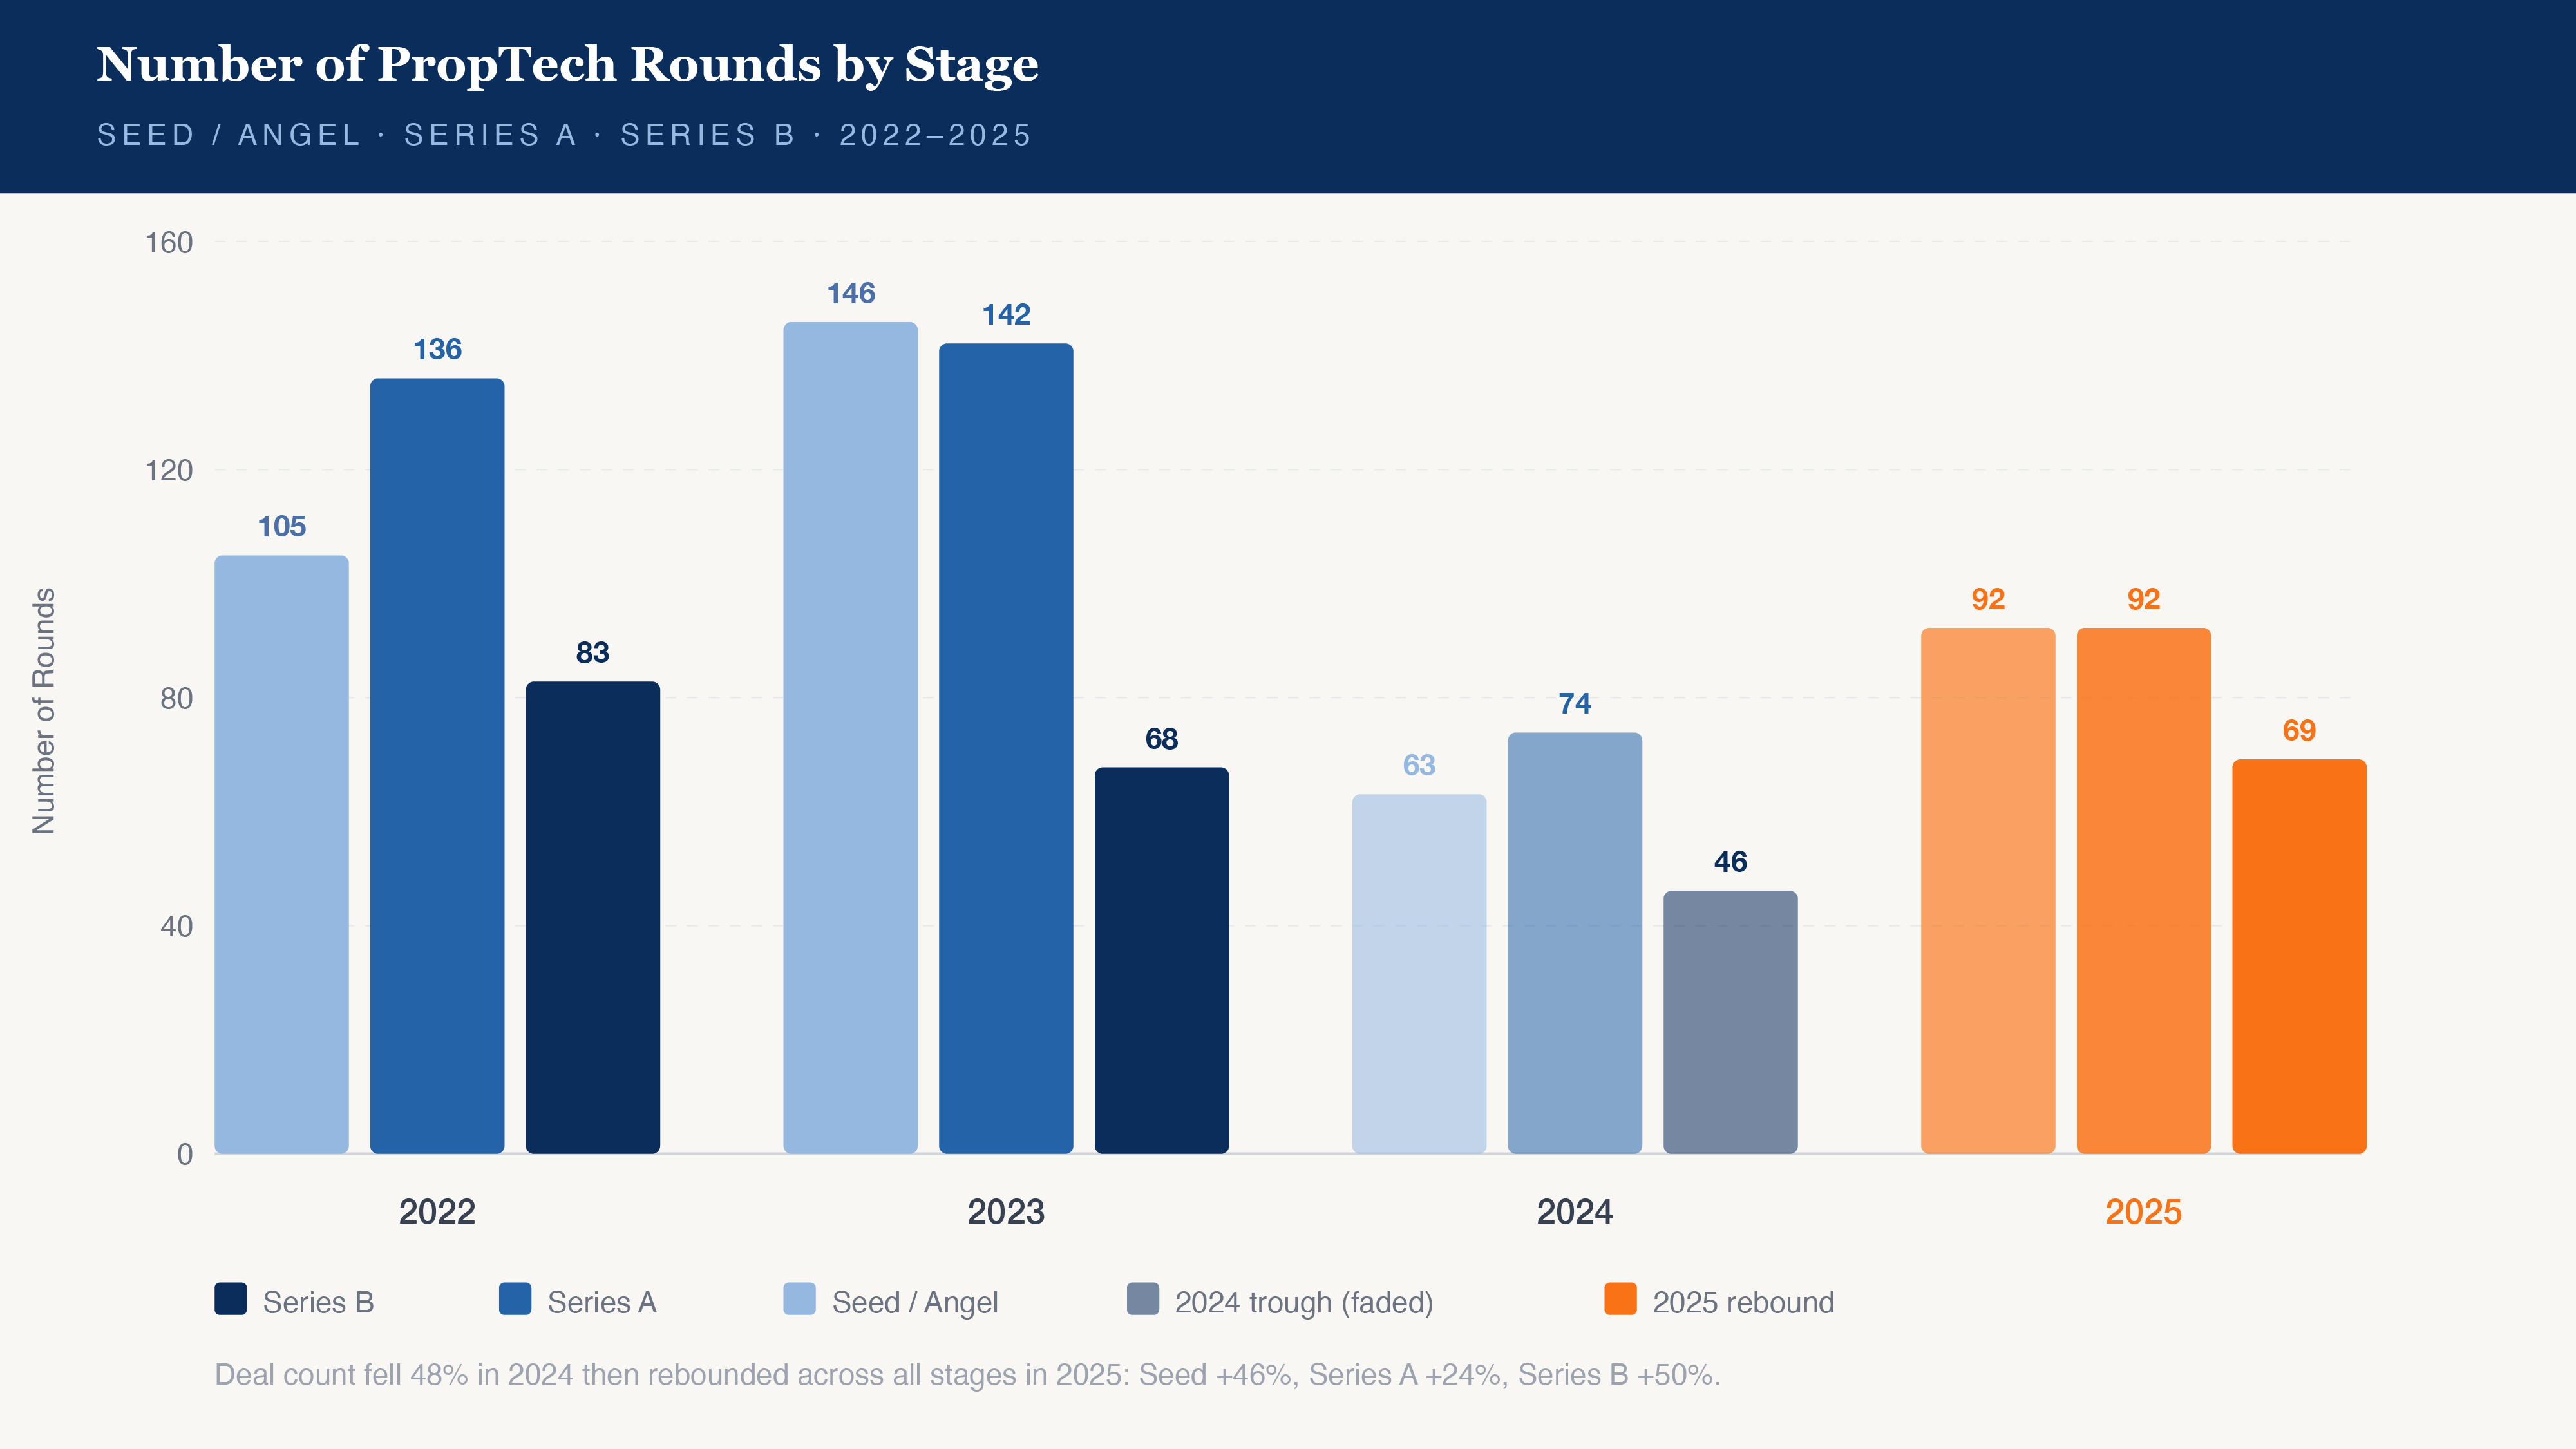
Deal activity rebounded across all early stages in 2025: Seed rose from 63 to 92 rounds (+46%), Series A from 74 to 92 (+24%), and Series B from 46 to 69 (+50%).
Median round sizes fluctuated within remarkably narrow ranges despite the volatility in deal count and total capital:
- Seed: $4-6 million (ranging from $4.4M in 2023 to $5.4M in 2024)
- Series A: $11-16 million (from $11M in 2023 to $16M in 2022)
- Series B: $28-39 million (from $28.5M in 2023 to $39M in 2025)
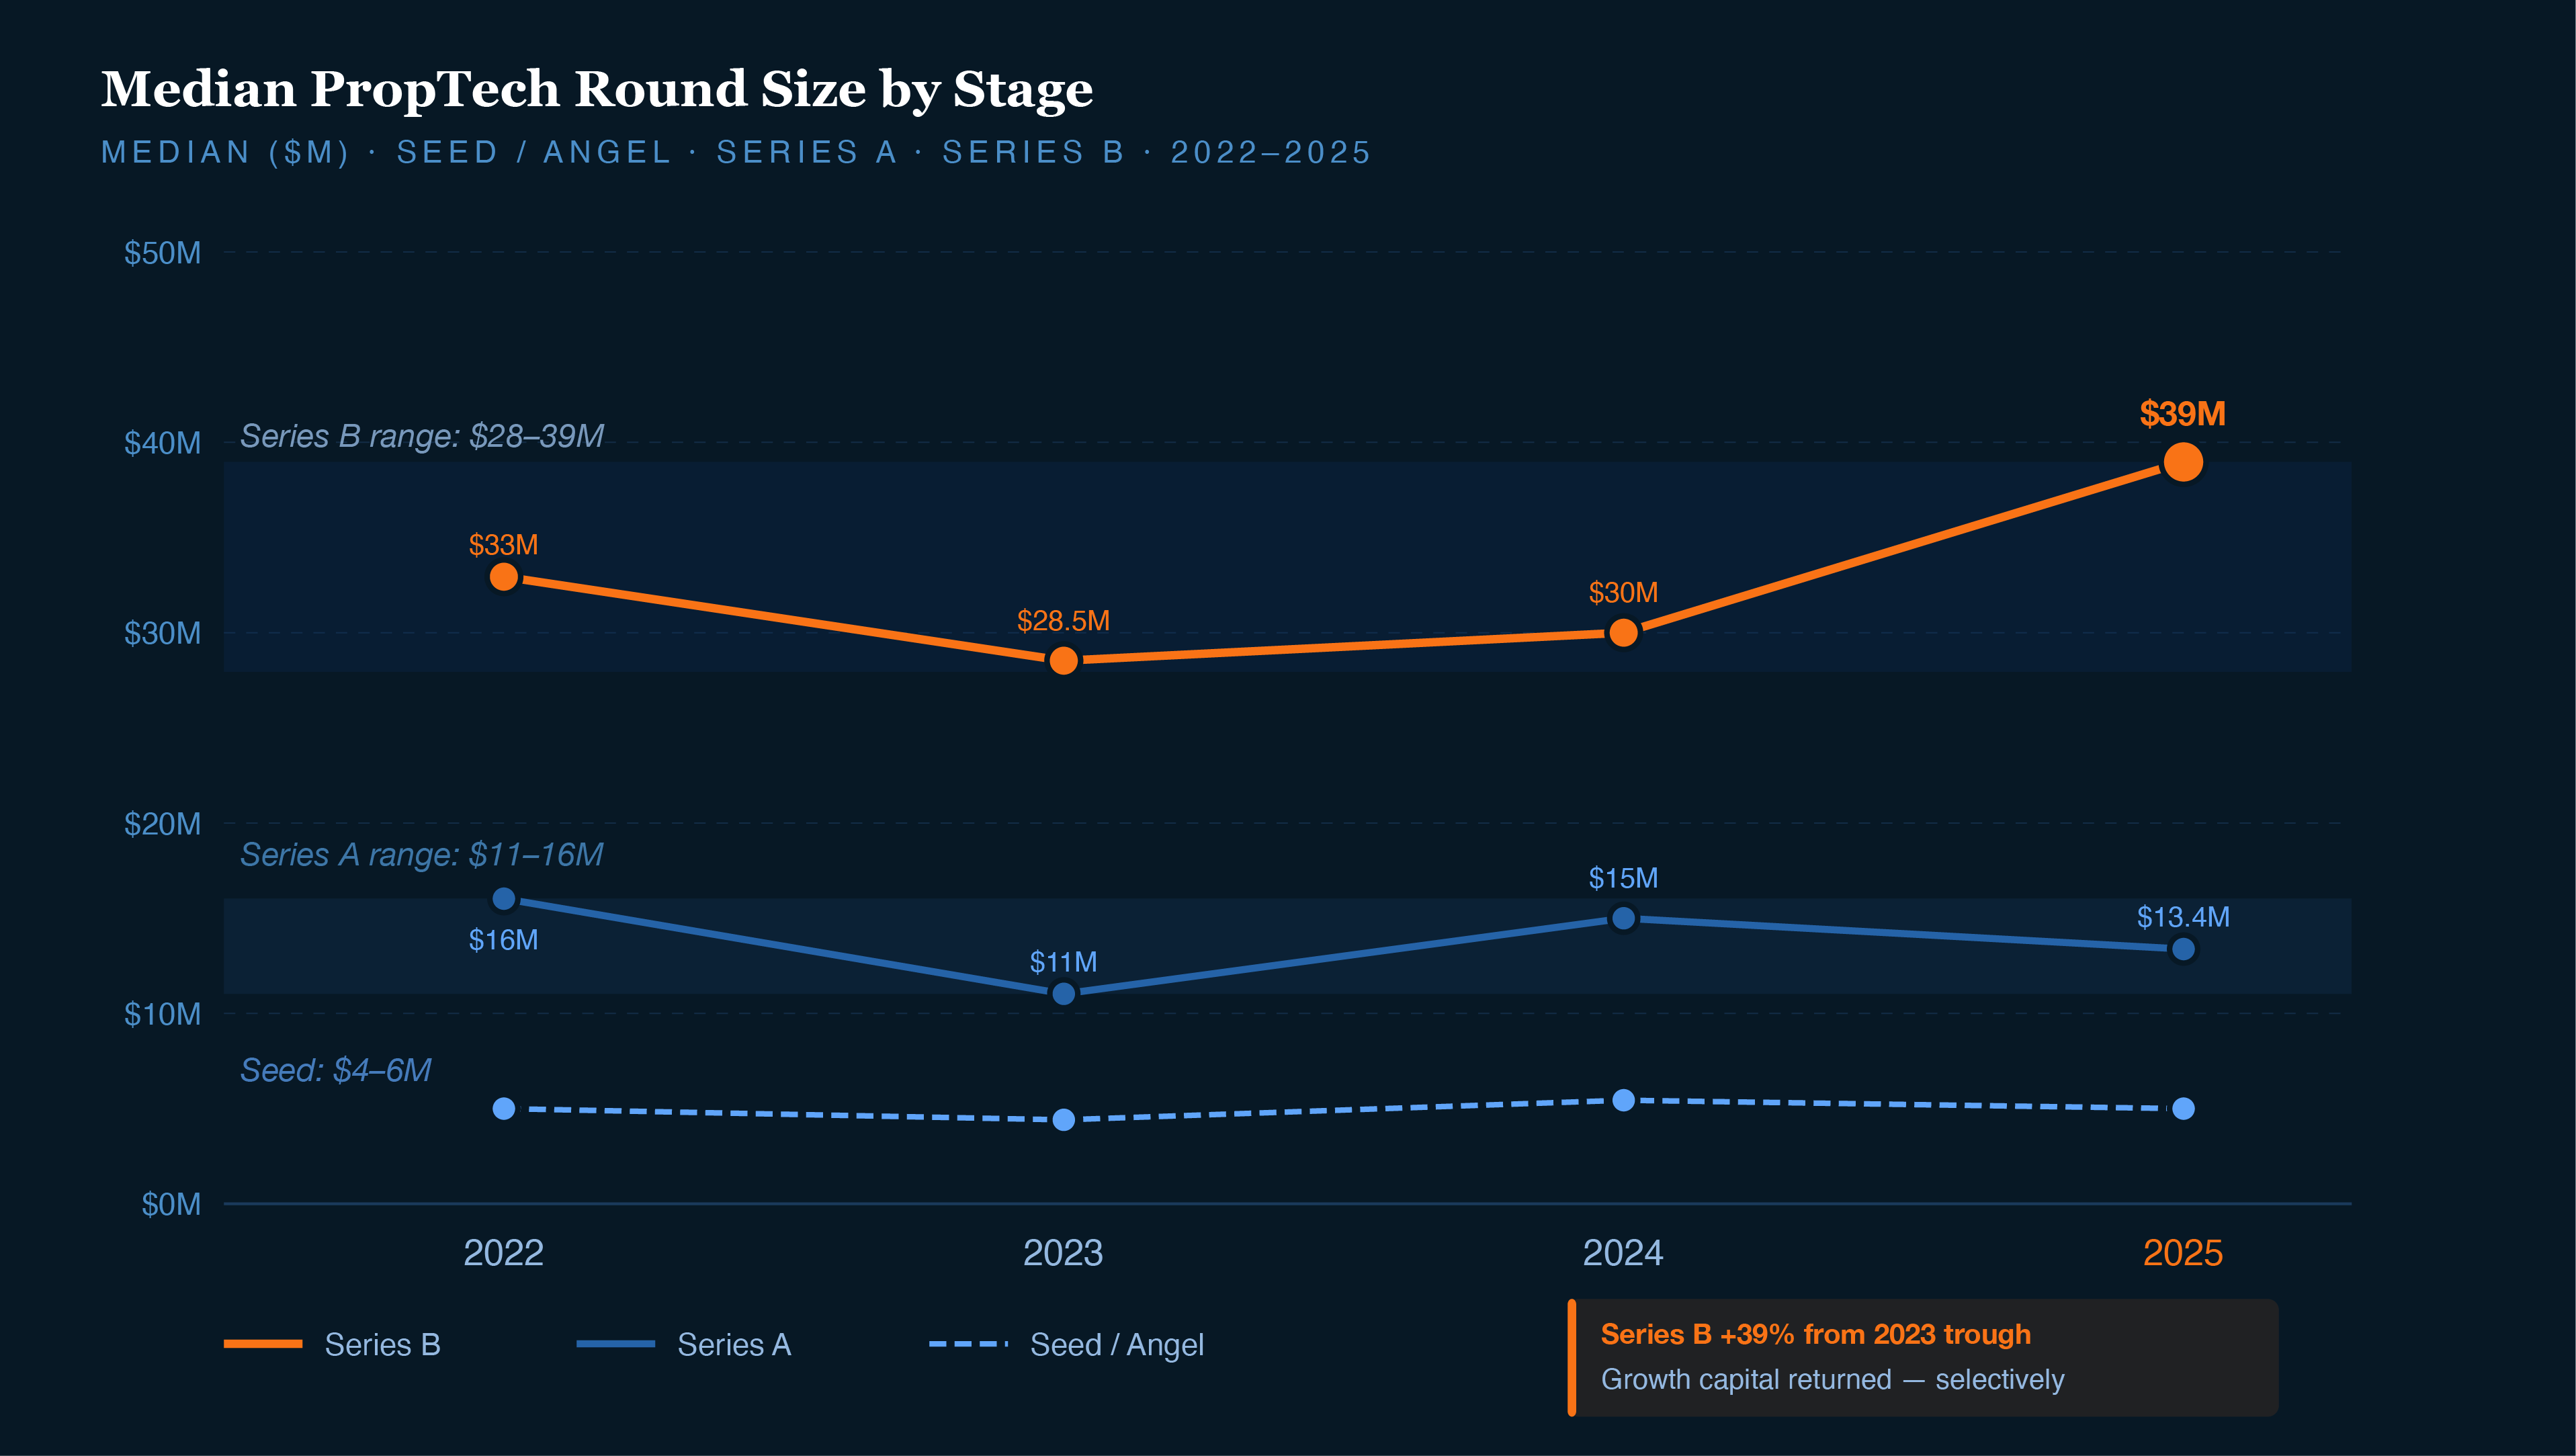
The most telling signal comes from Series B. After compressing to $28.5 million in 2023, medians recovered to $30 million in 2024 and jumped to $39 million in 2025, a 39% expansion from the trough. Growth capital has returned, but only for companies demonstrating clear market leadership and path to profitability. Seed and Series A medians, by contrast, barely moved during the same period.
Total capital deployment by stage reinforces this concentration: Series B led all stages at $14.5 billion over the four-year period, followed by Growth ($10.4B) and Series C ($8.8B). Series A contributed $7.3 billion, while Seed deployed just $2.6 billion.
Sector Analysis
Sector Divergence
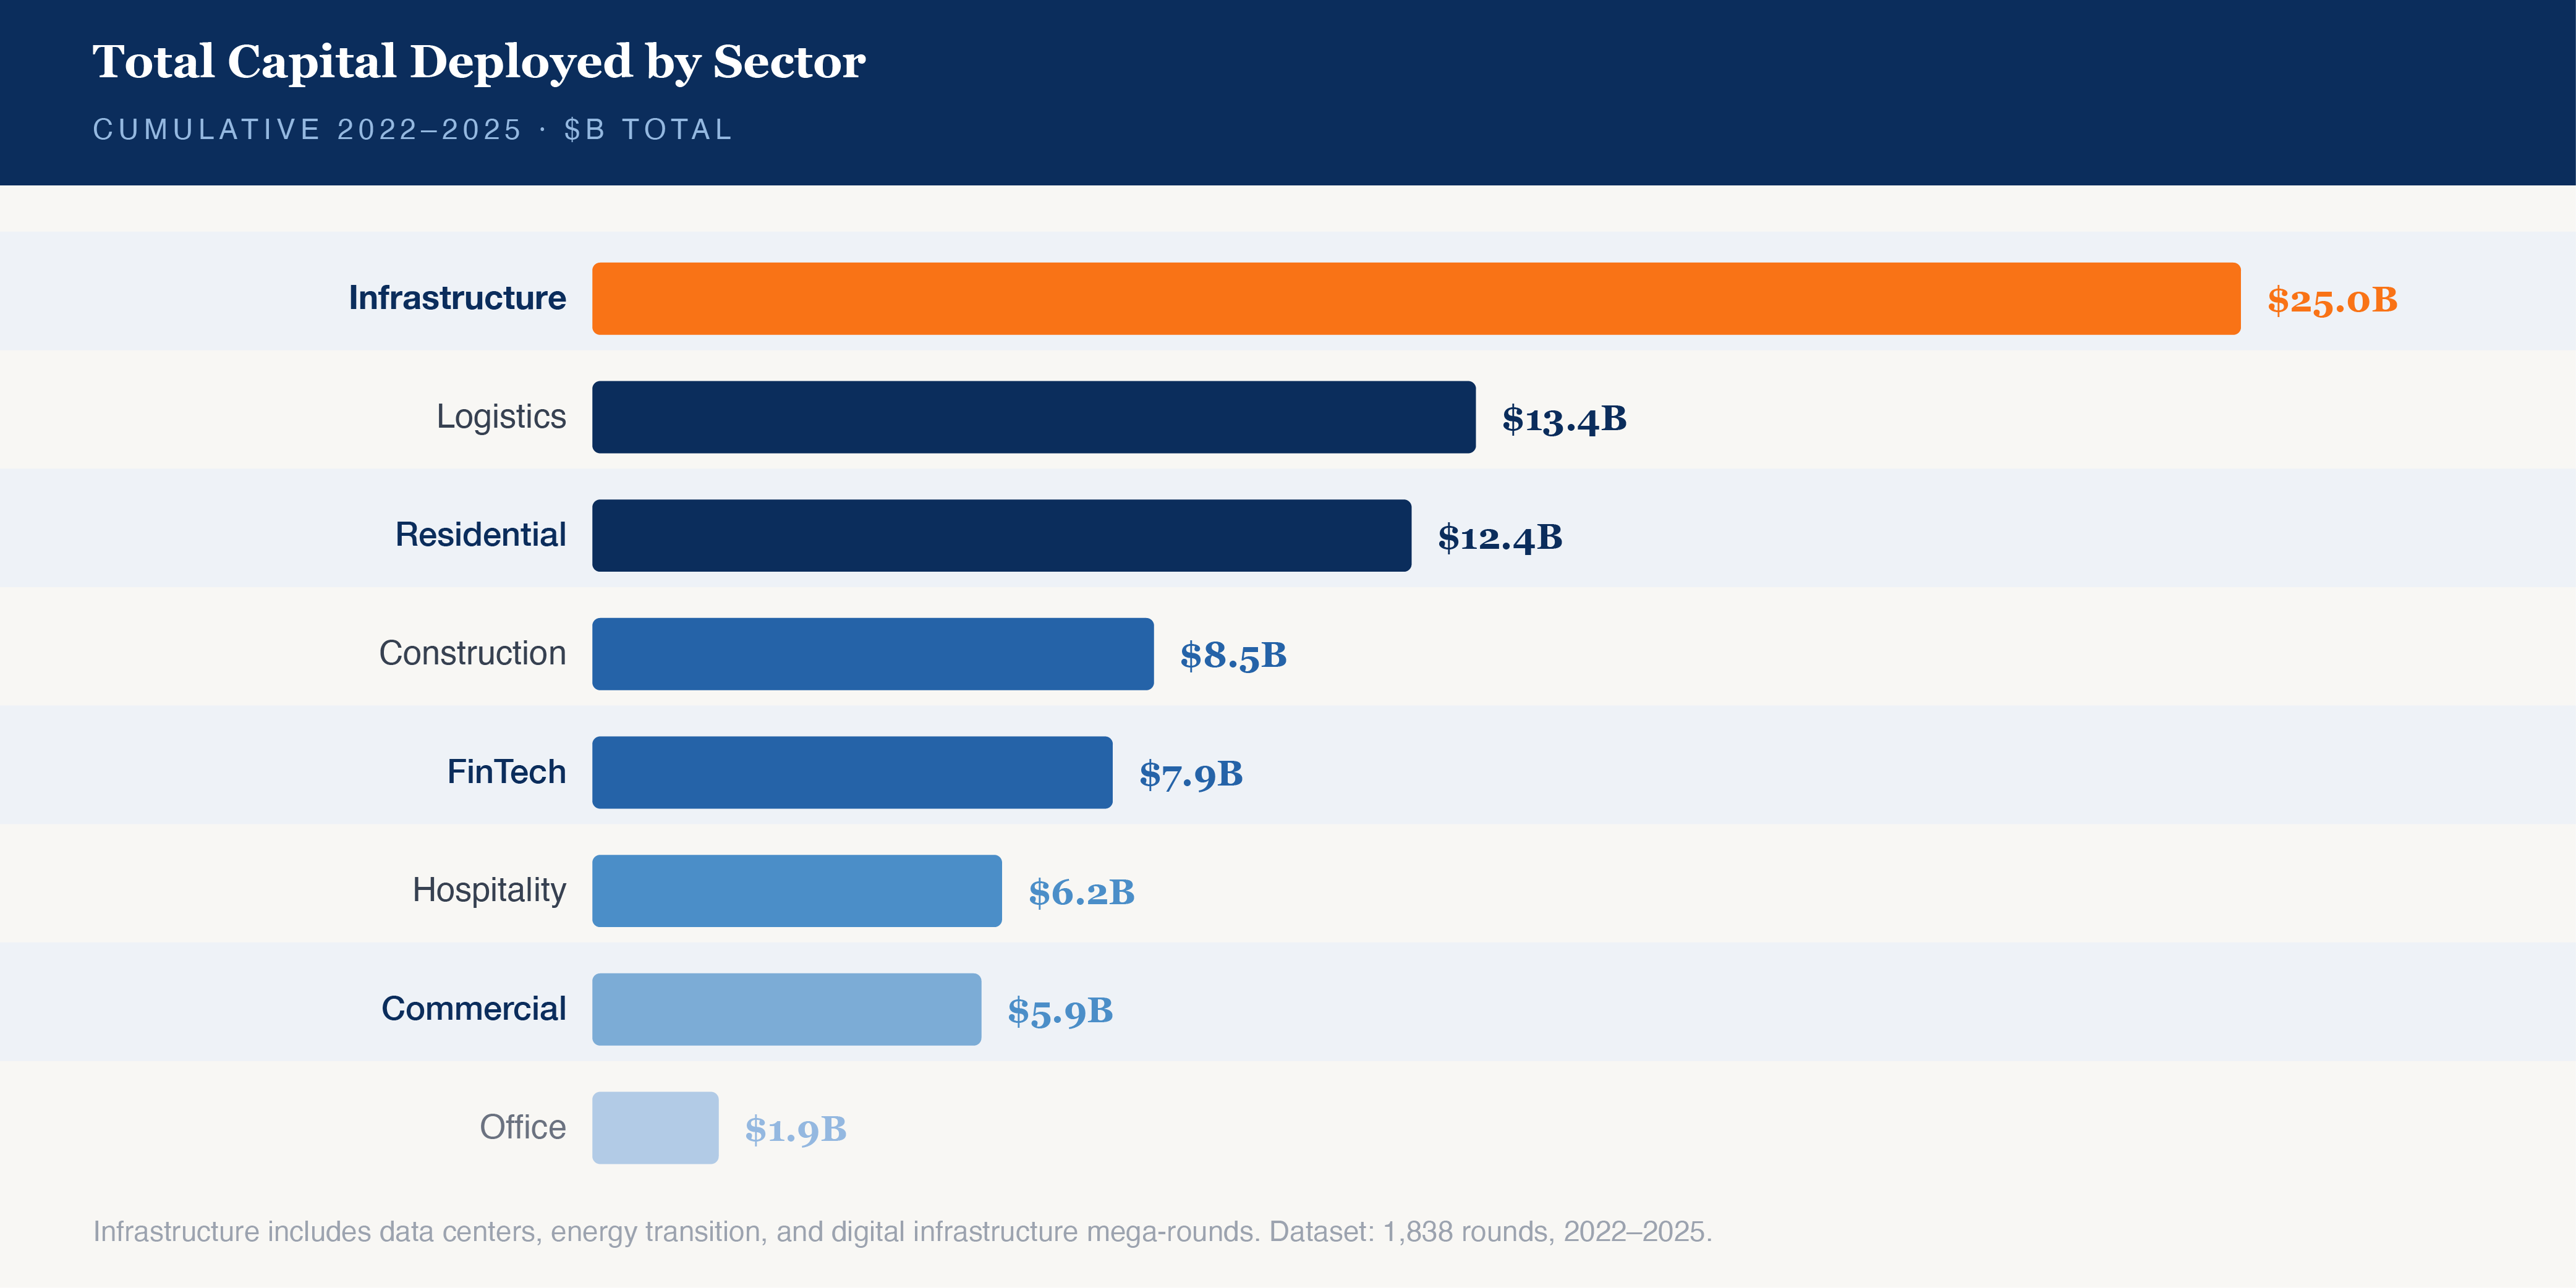
By capital deployed, Infrastructure dominates at $25 billion - 30% of total tracked funding. Logistics ($13.4B), Residential ($12.4B), and Construction ($8.5B) follow. But by deal count, the order reverses: Residential leads with 410 tracked rounds, followed by Construction (362) and Infrastructure (339).
Residential and Construction sectors remain dominated by earlier-stage, smaller-check activity. Both sectors comprise dozens of distinct, non-overlapping workflows, each representing a potential venture-scale opportunities, enabled by the rapid proliferation of frontier LLMs.
Infrastructure, by contrast, has become the domain of mega-rounds: Crusoe Energy ($1.4B), Base Power ($1.0B), GDS and GDS International ($2.2B combined), Nscale ($1.1B).
It's the built world's intersection with energy transition, data center expansion, and industrial decarbonization. These are capital-intensive businesses building physical infrastructure with technology as an operating layer - and they're increasingly where the largest outcomes are concentrating.
Sector Momentum
YoY Growth by Sector
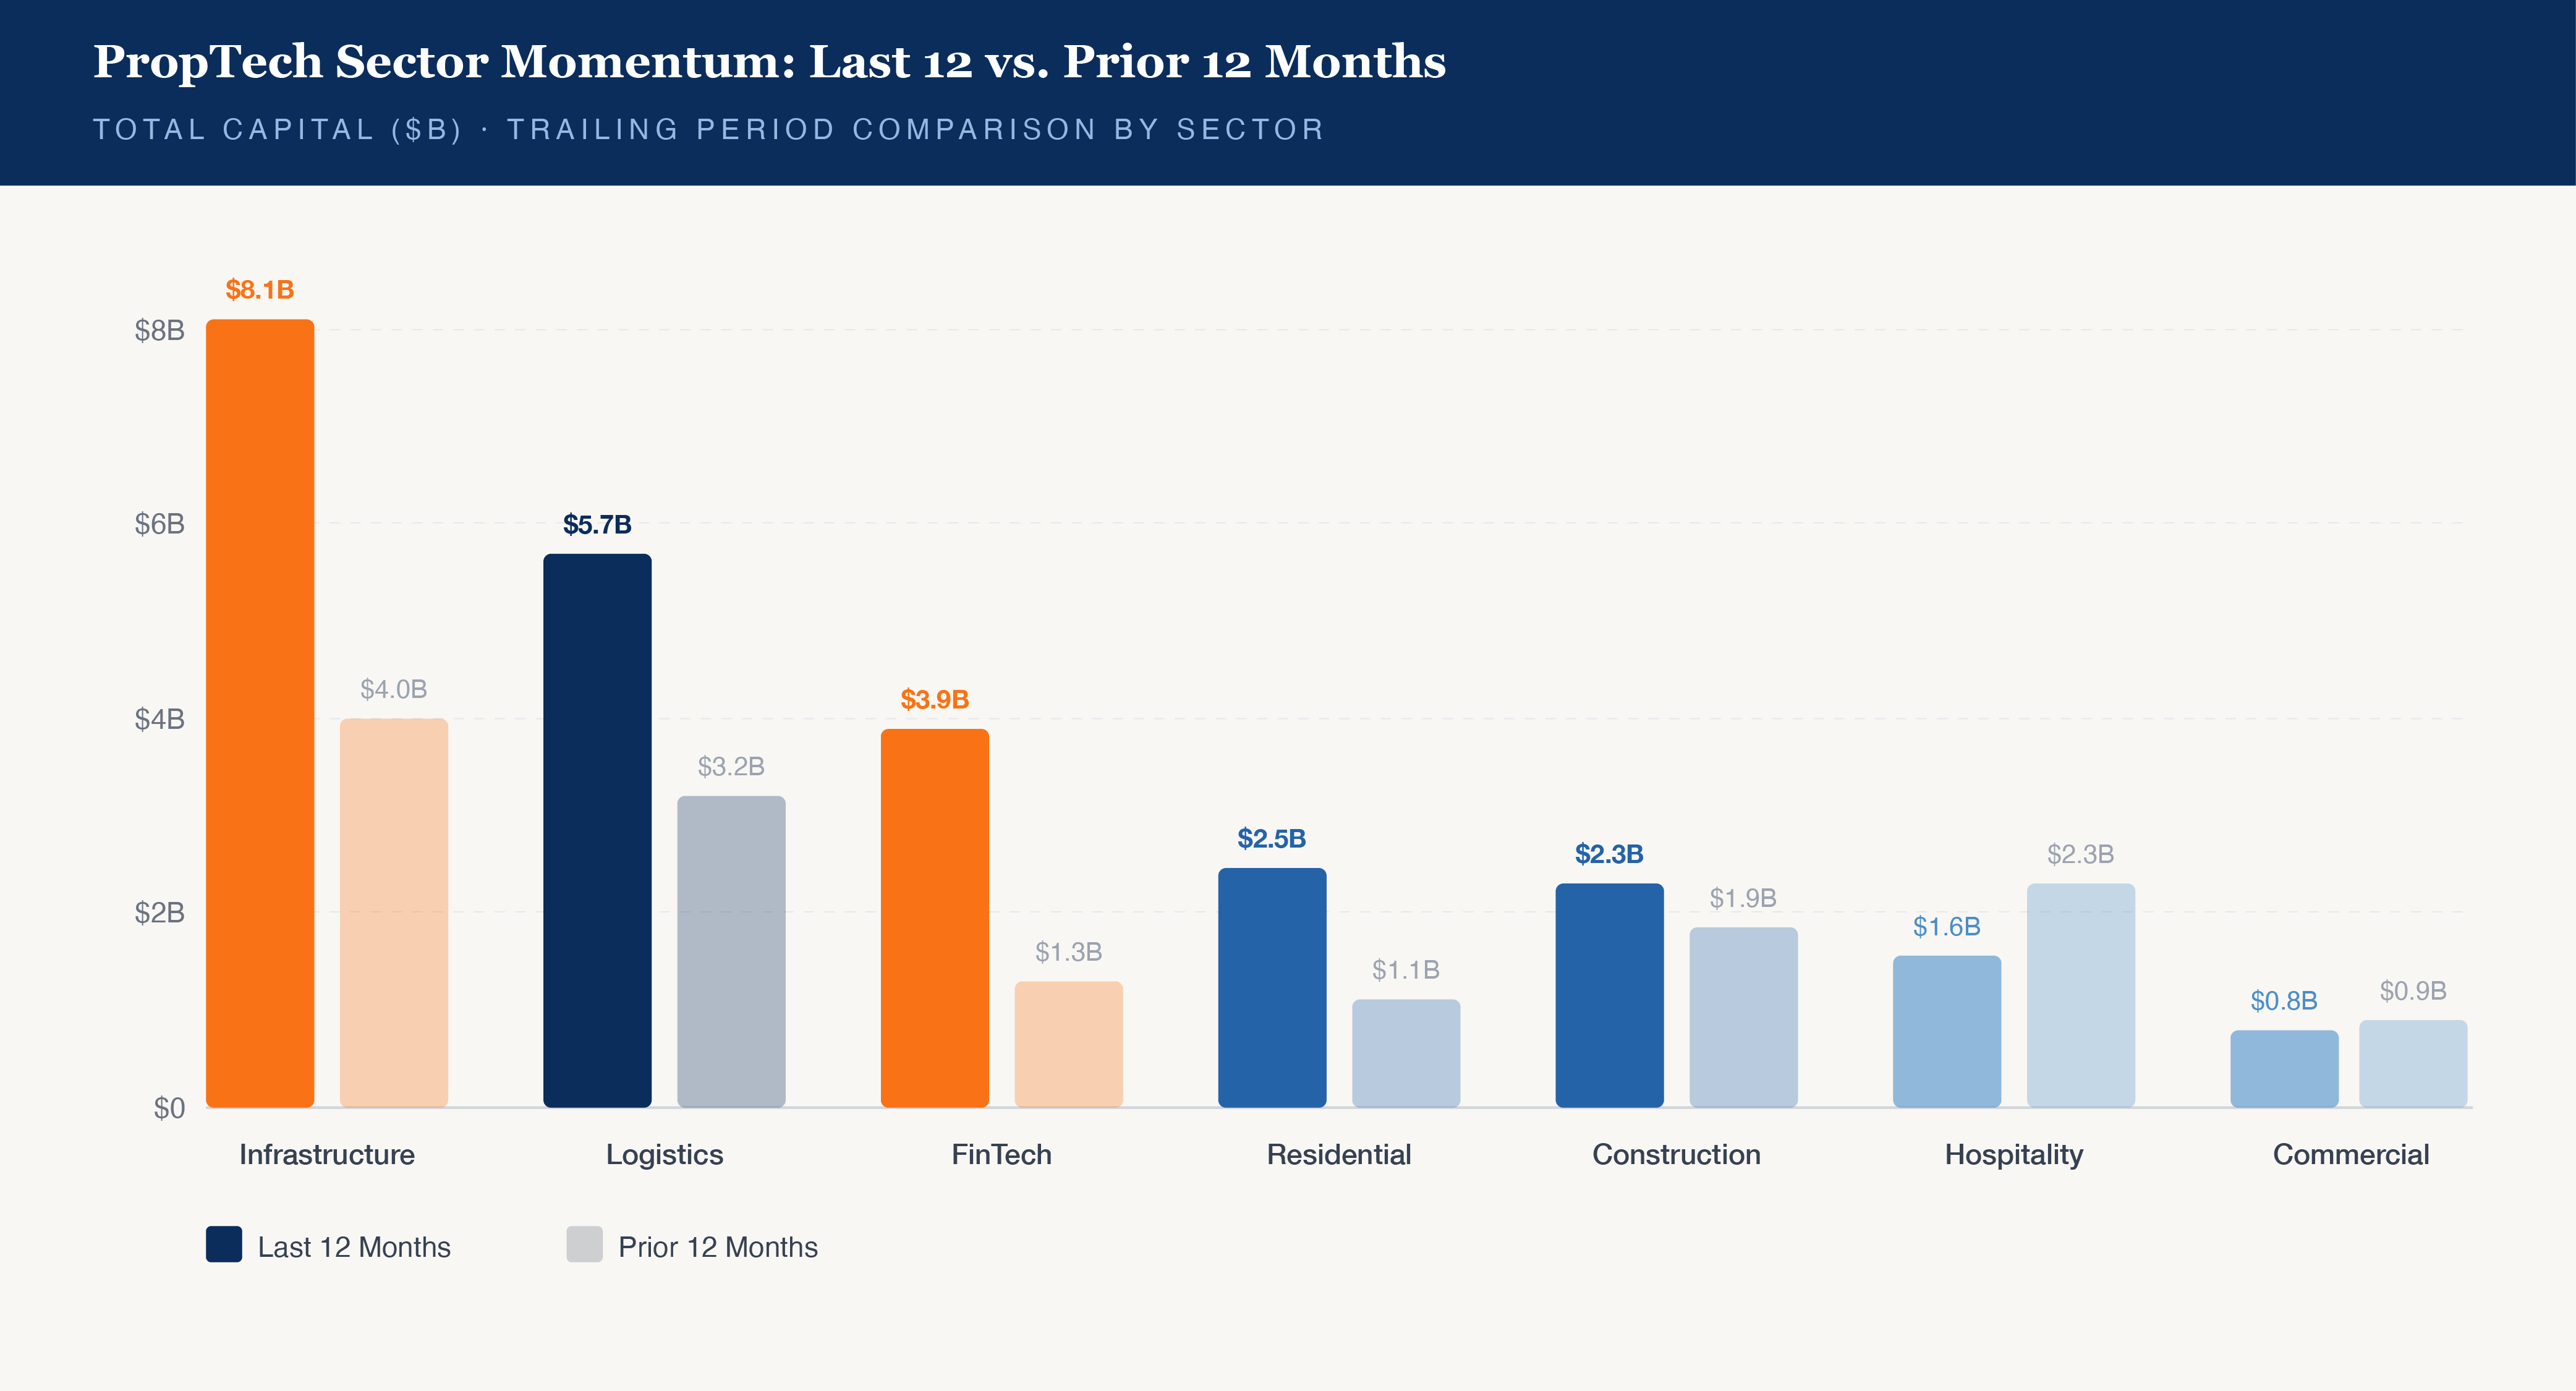
FinTech led all sectors in YoY growth, driven by significant rounds, including CoStar's $1.9 billion acquisition of Domain Holdings, Bilt Rewards' rise to a $11 billion valuation, and Juniper Square's unicorn status.
Logistics was the second-fastest mover, as instant delivery, last-mile, and fulfillment infrastructure attracted renewed interest. Notable rounds include Metropolis' $1.6 billion Series D for parking and mobility infrastructure.
Residential also accelerated sharply, while Construction Tech grew steadily, reflecting both pent-up demand and new AI-enabled capabilities. Construction remains the most active sector by deal count (101 rounds in 2025 alone), and capital is catching up to activity as the category matures beyond point solutions into integrated platforms.
Infrastructure remained the largest sector by total capital at $6.4 billion.
Market Structure
Sector Players
Analyzing lead investor frequency over the past four years reveals both the concentration of activity and the persistence of specialist capital.
By Deal Count
The leaderboard is dominated by PropTech specialists: Fifth Wall (54 leads), MetaProp (31), a16z (30), YC (24), and RET Ventures (23). Six of the top 15 most active lead investors are dedicated PropTech funds: Fifth Wall, MetaProp, RET Ventures, Brick & Mortar Ventures (17), Camber Creek (14), and JLL Spark (14), accounting for over 40% of activity among the top 15.
By Capital Deployed
The picture shifts significantly. Strategic and growth investors dominate: Softbank ($1.3B), General Catalyst ($980M), and a16z ($864M). These are fewer, larger checks, often single mega-deals that move the capital totals. Fifth Wall ($842M) is the only PropTech specialist appearing on both leaderboards, reflecting their unique position as both high-volume early-stage deployer and growth-stage participant.
Co-Investment Networks
The co-lead overlap data reveals distinct network clusters. PropTech specialists tend to co-invest with other specialists: MetaProp and JLL Spark share four (4) co-investments; Building Ventures and Navitas Capital share three (3); Camber Creek appears repeatedly alongside JLL Spark, Navitas, and FJ Labs. Meanwhile, generalists cluster together, Accel and General Catalyst share four (4); a16z frequently co-invests with YC and Khosla.
Generalist investors who were active in 2021-2022 have largely retreated or become more selective, while specialists have maintained consistent deployment. CRETI's data adds context: 37.5% of venture capital firms concentrated their 2025 investments into approximately three (3) deals.
For founders, relationships with specialist investors matter more than ever for deal access and lead rounds, but growth-stage capital increasingly comes from strategic and crossover investors writing larger checks.
Outlook
Looking Ahead
Several implications emerge for the year ahead:
For founders: The bar for Series A and Series B has materially increased. Companies that raised at aggressive 2021-2022 valuations without commensurate traction face difficult decisions, flat rounds, down rounds, and/or consolidation.
For investors: Early-stage activity remains robust, and the tight bands around Seed round sizes suggest entry valuations have not inflated. The opportunity set at growth stages is more selective but potentially more attractive - companies that have survived the 2023-2024 reset have demonstrated real durability. Infrastructure and FinTech-adjacent categories are where mega-outcomes are concentrating. Total capital deployment appears to have normalized, and median round sizes suggest valuations have found more sustainable levels.
Tagged: venture capital